


By Chris Stark and Craig Berry, Stark Capital Solutions
With more than two-decades of industry experience, we at Stark Capital Solutions have had our fair share of questions being asked by operators all around the country interested in what other billboard companies are up to. Most often they want to know if other operators are still building new signs, and if there are certain geographic areas more active than others. At Stark, we’re always assessing our deals and industry trends to create an even better client experience. Throughout that process, we’ve uncovered some answers to those burning questions and have some insight into how our experience has transformed from 15 years ago to now.
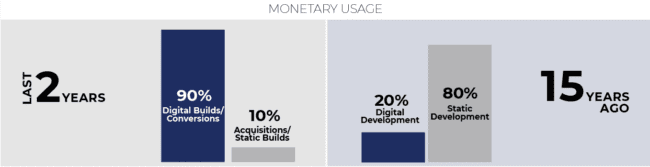
The Past Two Years
In the last 20 years, Stark Capital Solutions has closed over 400 transactions, creating over $350,000,000 in value for our clients. To get a better understanding of the industry shift in that time, we pulled the last two years of loan transactions and broke it into 5 sections.
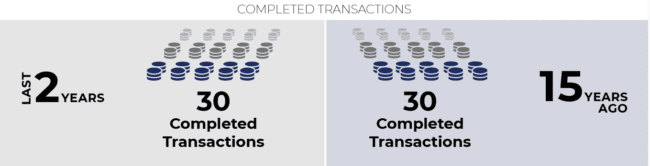
How many completed transactions?
30
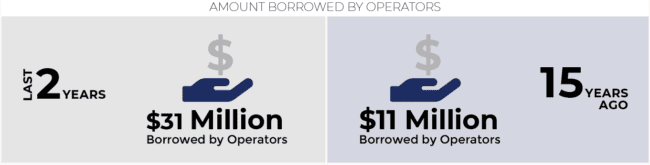
How much was borrowed by operators?
$31,000,000
What were they spending the money on?
90% were digital builds and conversions, 10% other (acquiring billboards or developing static/ billboards)
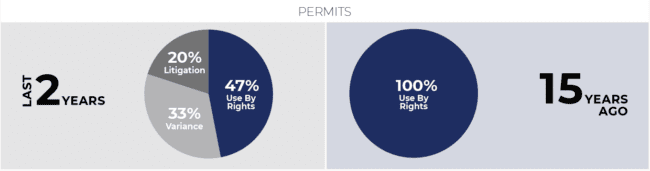
How were the permits obtained?
- 47% by right
- 33% by variance
- 20% by litigating (we’ll get to these terms in a minute!)
Where were we doing this? 28% markets with <30K population 36% mid-market (30K – 1mil) 36% metro (+ 1 mil major metro markets like Chicago, Los Angeles, etc.) Now, you may be wondering about a few key terms here, such as “by right” and “mid” or “metro” markets. Let’s break those down!
- By Right – the area’s ordinances allow it, meaning you have the legal right to apply and be granted a permit without a variance required
- By Variance – the ordinances do not allow it by right, so you must go through a process with the planning department and get permission from the zoning board
- By Litigation – in order to obtain the permit, you must litigate against city to prove their ordinance is not enforceable due to various deficiencies. These often end in a settlement, or court order to issue the permits
When talking about market sizes, we refer to different segments as:
- Small – a population less than 300,000
- Mid-market – a population of 300,000 to 1 million
- Metro – a population of more than 1 million
15 Years Ago Looking back at transactions from the last two years was interesting so we decided to take it one step further and pull the same data from transactions 15 years ago.
How many transactions?
30
How much was borrowed by operators?
$11,000,000
What were they spending the money on? (acquiring/building)
- 20% digital sign development
- 80% static billboard development
How were permits obtained?
100% were by right!
Where were we doing this?
- 24% small markets
- 57% mid-market
- 19% metro
It was very interesting to see the shift over the last two decades from static boards to digital. It is also insightful to see the substantial change in the availability of permits by right over the past 15-years. One thing is for certain — the industry continues to grow and adapt to meet the demand for quality billboard locations.
At Stark Capital Solutions, we care about being on top of shifts in the industry, and we will continue to track our transactions, and watch for other trends, to help us better serve our clients and the billboard industry.
[wpforms id=”9787″]
Paid Advertisement


Wow! This is great data and good information for an industry executive trying to weave my way through the decision path of conversion, acquisition/liquidation/mergers etc. Thanks!!